

What use are marketers if not for producing infographics no-one’s requested? And boy, today we have a prime example. You see, digital marketing strategy is complicated. There are just so many options, how can you know what to focus on? Website analytics play a part of the problem — often feigning precision and lacking substance. You may have an entire dashboard of pretty graphs, fancy stats, and heatmaps while gaining little in the way of actual strategic insights. Today’s blog and its accompanying infographic aim to bring order to this unruly chaos with a simple framework to help IT service providers determine where to focus their digital marketing efforts based on rudimentary metrics.
We’re going to keep things simple by focusing on two basic metrics that are ubiquitous among website analytics tools: time-on-site and traffic.
Time-on-site is measured in minutes. It measures the time in between someone first arriving on your website and them taking their last action on the site during that session. Consider that if someone arrives on your site and doesn’t take any actions (i.e. doesn’t click on anything), it is recorded as 0 seconds regardless of how much time they actually spent. So it’s not a perfect measurement and it shouldn’t be taken literally. But it does offer us some good insight into website engagement; a high time-on-site indicates that people are sticking around the site to do what we want them to do.
Traffic is a tally of how many visitors arrive to your site. It is most commonly expressed as a monthly sum. It unfortunately includes not just human traffic, but also spam traffic and bots as well, and there’s not much you can do to mitigate these pollutants of our data. So measuring traffic is also imperfect, but still it gives us a pretty good idea about how many people our website is reaching.
Based on our experiences working with hundreds of technology companies, we’ve developed a pretty good understanding about what to expect when peering under the hood of a website’s analytics tools.
If you’re landing in or around 2 mins time-on-site, you’re doing alright. That suggests people are kicking the tires on your services, are engaging with your content, likely clicking to multiple pages, and in general the website is doing what you hope it should do. However if you’re landing closer to 1 minute or less, that suggests the website is not performing like it should, and people are not interested and receptive to what they are finding. And conversely, if you’re closer to 3 mins or more, then your website is doing exceptionally well in terms of engaging visitors and giving them what they’re hoping to see.
It’s worth noting that how to interpret time-on-site is also influenced by the site’s design. Sites with longer and more informative homepages tend to have lower avg. time-on-site, because if visitors are getting the information they want from just the homepage, they may not need to take any “action” on the site (i.e. clicking on something), in which case their session will be recorded as 0 seconds. And it’d be 0 seconds regardless of whether they’d actually spent 1 min or 10 mins reading the homepage. So it’s advisable to adjust your expectations based on the particulars of your website. But still, an average of 2 mins is a good rule of thumb.
While more traffic is almost always better, and certainly there are some large web hosting companies and MSPs who far exceed 10k visitors per month, this range represents our typical experiences working with our clients, most of whom are in around 1,000 visitors per month. The smallest are closer to 100 visitors per month, and the larger more established companies are closer to 10,000 visitors per month.
Where does your I.T. company’s website fall in our infographic?
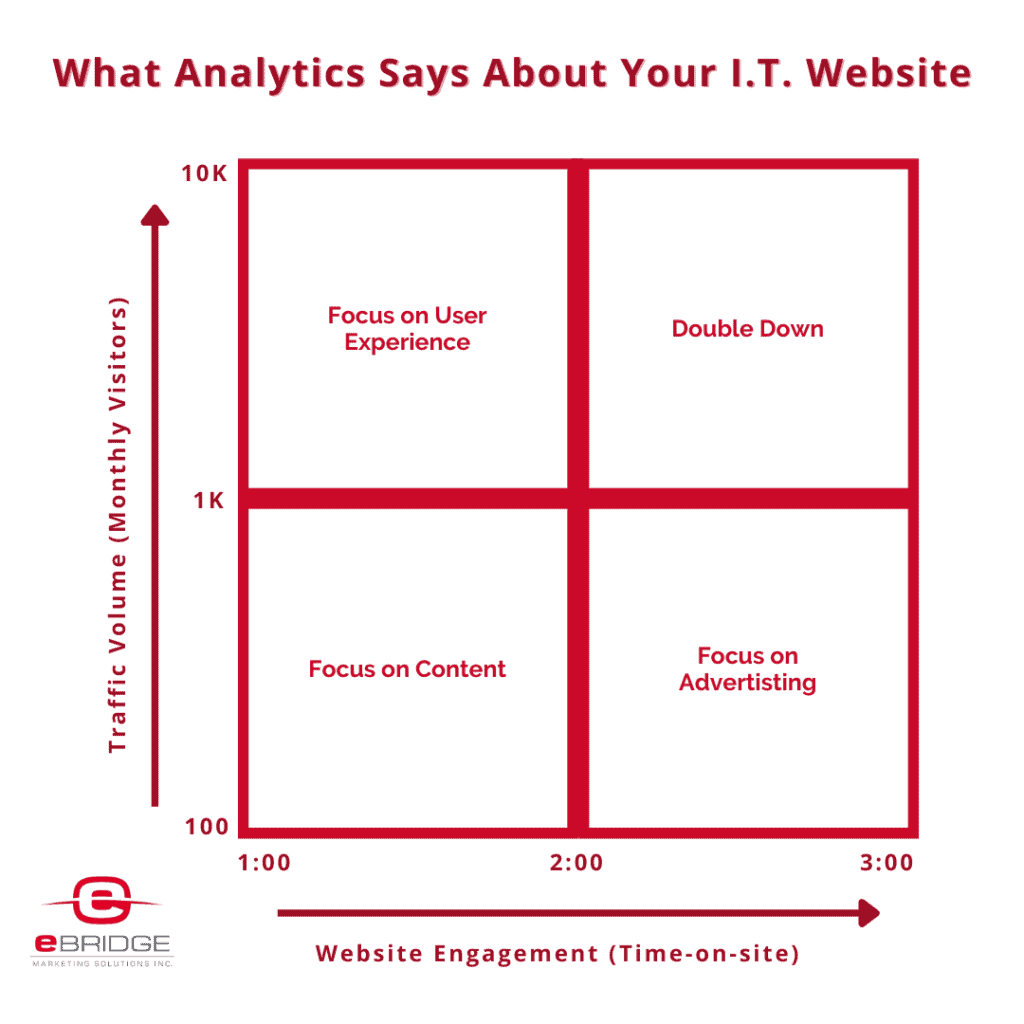
If your website isn’t getting a lot of eyeballs on it, and those who’s attention you do attract tend to wander away more quickly than you’d like, then the best antidote is content creation. By creating content, you address both shortcomings. Because not only by producing content are you giving people more stuff to interact with on your site, which will make them stick around longer, but from an SEO perspective it will help attract more visitors to your site as well.
Tip: At a bare minimum, try to blog once per month, but once a week is ideal.
If your website isn’t getting a lot of visitors, but those who do visit are highly engaged, it suggests the bottleneck is not with the website itself. Instead, it’s recommended to focus outside the website towards the goal of increasing traffic levels. The best tactic to-do-so is advertising because with immediacy you can get the desired effect of more website visitors.
Tip: Google Ads are more costly near large cities due to the increased competition.
If your website is getting a lot of traffic but those people aren’t doing what you want them to do, then that suggests the user experience needs to be improved. This involves putting yourself in the position of someone not familiar with your company and trying to understand the friction points they experience. It’s a cliché, but take a look at your homepage above-the-fold, can a new user figure out what your company does within 10 seconds? Can they easily find navigate to find additional information? Are they being shown calls-to-action so the next step is simple if they are indeed interested in purchasing or contacting you? Improving your website’s UX is multi-faceted and may involve design, content, and changes to website architecture.
Tip: Go through the motions and review the journey from homepage through to checkout or form fill out.
If your website has high traffic and high engagement, good job. Double down and keep doing more of what you’re doing.
Tip: If this is you, then sorry, you didn’t need this blog. This is like the final season of Game of Thrones, there’s no pay off for you here.
Are you interested in taking a strategic approach to evolving the digital marketing and website of your IT service company? We can help! Contact us to get started.

As eBridge’s VP of Operations, Devin Rose brings marketing expertise and an entrepreneurial knack to the eBridge team. Devin holds a Bachelor of Commerce Degree from Royal Roads University and a Marketing Management Diploma from the British Columbia Institute of Technology.
Posted May 10, 2022
Categories: Advertising and Marketing General
Tags: Advertising, Content Creation, Infographic, User Experience